
New Zealand Law Commission

|
|
[Home]
[Databases]
[WorldLII]
[Search]
[Feedback]
New Zealand Law Commission |
|
[Database Search] [Name Search] [Previous] [Next] [Download] [Help]
162 In this chapter we suggest that Mäori women are involved in the justice system as victims, offenders and as whänau support more often than the available data records. The absence of data is itself symptomatic of a failure to understand the manner in which the justice system affects Mäori women.
163 Many of the statistics used in this analysis relate to Mäori generally. Only when it is clear that Mäori women’s experience is significantly different from that of men are women separated out. The analysis is a cross-sectional one, focusing on disparities between Mäori and non-Mäori at a particular point in time. It does not look into past trends. Within the confines of this report it is not possible to go into the issues in detail. The statistics used have been selected to represent the main factors involved in determining the relative position of Mäori. These statistics are in the nature of broad indicators rather than exact measures of that position.
164 The analysis has been constrained by the fragmentary nature of the available data. Information specifically about Mäori women as users of the justice system and related services is incomplete. Moreover, data that could help to show the influence of cultural differences on the relative socio-economic position of Mäori and non-Mäori is extremely limited.
165 We provide some background data on the women’s concerns about the geographic distribution of services and then go on to affordability issues. These are examined in the context of the relative socio-economic position of Mäori and non-Mäori. We regard socio-economic issues as having a cultural dimension, and it is in a socio-cultural context that the issue of agency responsiveness to Mäori is considered. Our analysis suggests that demographic, cultural and socio-economic factors intertwine in a way that entrenches and perpetuates disadvantage. Disadvantage and poverty tend to take the form of a vicious circle, such that low income can be seen as both a cause and an effect of such things as low educational achievement and poor employment outcomes.
166 There were two recurring relevant themes arising out of the consultations with Mäori women about barriers to justice. These were:
These matters can be more readily understood if they are seen in the context of the relative position of Mäori, and Mäori women in particular, in New Zealand society.
167 Mäori women and their families are over-represented on the lowest rung of the socio-economic ladder. To a large extent their position has been shaped by historical factors and in particular, by the assimilative policies and practices of past administrations (see discussion in chapter 2). These are reflected in the undermining of traditional Mäori institutions, the Mäori language and other manifestations of Mäori identity. In spite of erosion, however, Mäori institutions such as the whänau, the hapü and the iwi have adapted to meet new challenges and new conditions; many of the values, beliefs, expectations and practices that underpin them continue to influence Mäori behaviour. The failure of successive governments to remove the disparities between Mäori and non-Mäori has been attributed to an unwillingness on the part of policy-makers to consider Mäori cultural factors alongside social and economic ones.
168 From the available statistics about the criminal justice system it is evident that Mäori constitute a very high proportion of its users. However, for the purpose of determining exactly what the proportion is, the statistics are inadequate. The information is restricted to offenders yet many of the women who use the services could not be classified as offenders. Some will be the partners of men who offend. Others will be the mothers of young offenders. As a result, there is no information from which a complete count of service users can be obtained. It can be inferred from the following tables that the proportion of Mäori women among the criminal justice system’s users may be higher than that suggested by the number of female offenders.
|
Table 1: Offender apprehensions: Total and Mäori 1997
|
|||
|
|
Offender Apprehensions
|
||
|
Gender and age
|
Mäori
|
Total
|
% Mäori
|
|
Women aged 17+
|
12,173
|
27,436
|
44.4
|
|
Men aged 17+
|
45,473
|
122,996
|
37.0
|
|
Children and young persons
|
21,124
|
44,654
|
47.3
|
|
Source: Ministry of Justice 1998
|
|||
|
Note: Data relates to recorded offences
|
|||
169 Apprehension statistics relate to the activities of the police. An impression of the proportion of Mäori women who might use the courts’ services can be obtained from the next table.
|
Table 2: Prosecution cases involving Mäori: Percent all cases in each
age group 1997
|
||||
|
|
Males
|
Females
|
||
|
Age group
|
Number
|
% all cases
|
Number
|
% all cases
|
|
14–19 years
|
6,913
|
40.6
|
1,589
|
47.7
|
|
20–24 years
|
6,524
|
39.1
|
1,517
|
52.5
|
|
25–29 years
|
4,637
|
41.2
|
1,228
|
51.7
|
|
30–39 years
|
5,468
|
40.0
|
1,414
|
48.4
|
|
40+ years
|
1,978
|
27.7
|
506
|
33.8
|
|
Total
|
25,520
|
38.8
|
6,254
|
48.1
|
|
Source: Ministry of Justice 1998
|
||||
170 Depending on the sentence imposed, some offenders may go on to become the responsibility of the Corrections Department. Others may become users of community-based programmes. The next table is used as an indicator of the proportion of Mäori women who might be involved at this stage, not just as offenders, but also in the ways already described.
|
Table 3: Convicted non-traffic cases involving Mäori by sentence type
1997
|
|||
|
Sentence type
|
Mäori
|
Total
|
% Mäori
|
|
Imprisonment
|
3,550
|
6,777
|
52.4
|
|
Periodic detention
|
6,389
|
12,991
|
49.2
|
|
Community programme
|
231
|
347
|
66.6
|
|
Community service
|
1,807
|
3,851
|
46.9
|
|
Supervision
|
1,742
|
4,122
|
42.3
|
|
Monetary
|
6,207
|
17,901
|
34.7
|
|
Deferment
|
1,308
|
3,247
|
40.3
|
|
Other
|
5
|
17
|
29.4
|
|
Cost/no sentence
|
1,393
|
3,275
|
42.5
|
|
Source: Ministry of Justice 1998
|
|||
171 Even with the information set out, it is still not possible to get anything other than a general feel for what the relative size of the Mäori female statistics may be. As well as being limited to offenders, there are problems with the data. First, the recording of ethnicity across the justice sector is known to be unreliable. Second, the statistics refer to cases and in any given year it is possible for the same person to be counted more than once. Third, some Mäori men do not have Mäori partners and some Mäori children do not have Mäori mothers. Fourth, the information is restricted to offending: it does not extend to victims.
172 Successive surveys have found that Mäori women carry a higher risk of becoming victims than do non-Mäori women. In particular, Mäori women are at higher risk of partner abuse. Support for these findings comes from the New Zealand National Survey of Crime Victims 1996 and statistics collected by the National Collective of Independent Women’s Refuges. In the 10 months between 1 July 1996 and 30 April 1997, Women’s Refuges assisted a total of 5,783 new clients, 2,600 (45.2 percent) of whom were Mäori. Among them, these women had an average of 1.6 children. Mäori men made up 40.5 per cent of the abusers.14
173 The representation of Mäori women among victims of domestic violence and of Mäori men among the abusers of women dealt with by the Collective of Independent Women’s Refuges is many times greater than the representation of Mäori women and men in the New Zealand population as a whole. At the 1996 Census Mäori men and women made up 11.7 and 11.8 per cent (respectively) of the total New Zealand population aged 15 years and over.
174 Given the statistics on offending and the survey findings on victimisation, Mäori women can be expected to make up a high proportion of the clients of related social services such as the Children and Young Persons Service and the health services. They can also be expected to be major users of Mäori and other voluntary community-based services such as the Women’s Refuges, marae and church organisations. Enquiries were made with the Children and Young Persons Service about the availability of statistics on their Mäori clientele but this information was not publicly available at the time of writing.
175 The above information suggests a high involvement of Mäori women in justice sector services, yet many of the women who participated in the consultation felt cut off and alienated even from the most heavily utilised services. In the following sections, we will explore the possible reasons why the services might be failing to respond appropriately to Mäori concerns. We do this by examining the different contexts in which Mäori women’s concerns need to be understood.
176 Some of the concerns raised during the consultations, particularly those relating to physical distance from government services, need to be seen in the context of the size, demographic structure and geographic distribution of the Mäori population.
177 Mäori people, who were thought by nineteenth century commentators to be dying out, now number well over half a million (523,000). Females outnumber males by a very narrow margin and, compared to the non-Mäori population, the proportion of children and young adults is very high.
178 Figure 1 compares the age distribution of the Mäori and non-Mäori populations. It shows that over half the Mäori people (56.5 percent) are under 25 years of age. The comparable figure for non-Mäori is
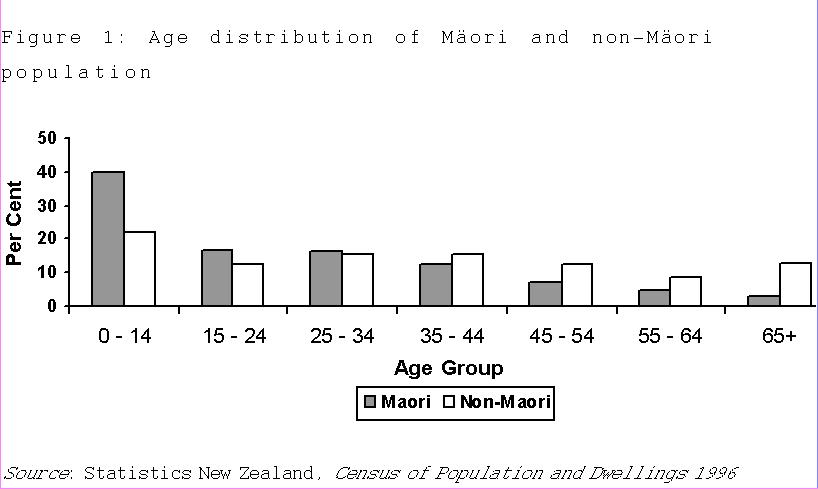
just over one third (34.6 percent). Conversely, people aged 65 years and over comprise just 3 percent of the Mäori population while non-Mäori in the same age group make up 13.1 percent of the non-Mäori population.
179 Between now and 2051, the Mäori population is expected to rise to close to 1 million (993,000). Over this same period, the proportion of Mäori in the total population is projected to increase from 15 percent to 21 percent. Massive changes are expected to occur in the age structure with the proportion of elderly Mäori rising from 4 percent to 13 percent of the Mäori population. Even in the year 2051, however, the Mäori population will still have a younger profile than the non-Mäori.
180 Physical distance from justice sector services is a major problem, especially for women who live in rural areas. As the following discussion shows, proportionately more Mäori women are likely to face this problem than non-Mäori women.
181 More than half of all Mäori (58 percent) live in the northern half of the North Island with the greatest concentration occurring in the Auckland region. However, while 24 percent of all Mäori live in the greater Auckland area, Mäori make up a less significant component of the population there than they do in other regions. Fifteen percent (15 percent) of the total population of New Zealand is Mäori. Within some regions, the proportion greatly exceeds this figure:
182 Although the Mäori population is heavily urbanised, Mäori are still more likely than non-Mäori to be living in provincial cities, small towns and rural areas. This difference in the urban-rural pattern of Mäori and non-Mäori is illustrated in table 4.15
|
Table 4: Urban-rural distribution of Mäori and non-Mäori by
gender 1996
|
||||
|
|
Mäori
|
Non-Mäori
|
||
|
Urban area
|
Males
|
Females
|
Males
|
Female
|
|
Metropolitan (100,000+)
|
34.5
|
35.1
|
49.0
|
50.0
|
|
Main (30,000+)
|
27.3
|
27.8
|
22.5
|
23.1
|
|
Secondary (10,000-29,999)
|
7.1
|
7.0
|
5.5
|
5.7
|
|
Minor (1,000-9,999)
|
13.6
|
13.8
|
7.7
|
7.8
|
|
Rural
|
17.5
|
16.3
|
15.2
|
13.4
|
|
Total
|
100.0
|
100.0
|
100.0
|
100.0
|
|
Source: Statistics New Zealand, Census of Population and
Dwellings 1996
|
||||
183 Problems of distance are accentuated by lack of access to a telephone or a motor vehicle. According to the 1996 Census, Mäori are less likely than non-Mäori to have access to either of these amenities. Eighty-four percent of Mäori women had access to a telephone and 81 percent to a vehicle. The comparable figures for non-Mäori women were 97 percent and 91 percent.
184 The affordability of legal advice and representation was another major concern of the women who attended the consultations. In this section, we investigate the background to this concern.
185 Income is the principal determinant of socio-economic position in New Zealand society. People who have a reasonable income

have greater freedom, more choices, better access to services, and better life chances than those who do not. Compared to non-Mäori, Mäori household incomes are low. As a result, it is not as easy for them to access services which have to be paid for.
186 Household income represents the combined incomes of all household members. As shown in figure 2, while a few Mäori live in households with an annual income of $100,000 or more, most (58 percent) live in households with an annual income of less than $40,000.
187 Moreover, Mäori households do not just have lower incomes, they also tend to have more members than non-Mäori households. Under these circumstances, Mäori are less likely than non-Mäori to be able to find the money to access the services offered by lawyers and other professionals. Indeed, information about expenditure patterns drawn from the Household Economic Survey shows quite clearly that Mäori households spend considerably less than non-Mäori households on insurance and financial and legal services. As at October 1997, the average weekly expenditure on these services was $14.00 for Mäori households and $20.10 for non-Mäori households.
188 The relatively low household income of Mäori reflects low personal incomes. It is in this respect that the extent of Mäori women’s socio-economic disadvantage becomes apparent.

189 As figure 3 demonstrates, when compared to the other three groups, Mäori women are over-represented in the very lowest income bracket and under-represented at the higher levels of the income scale.
190 A number of different factors have a bearing on the relative income levels of Mäori and non-Mäori. First, income is age-related. Since the proportion of Mäori at the younger ages of the labour force is greater than that of non-Mäori, Mäori cannot be expected to have the same earning capacity as non-Mäori. However, as figure 4 shows, even when age is controlled for, Mäori age-for-age receive less than non-Mäori.

191 Second, income is employment-related and, in the labour market, Mäori are disadvantaged by age, by geographic distribution and by comparatively low qualifications and skills. In respect of their qualifications, Mäori women are more disadvantaged than Mäori men. This is demonstrated in table 5.
|
Table 5: Mäori and non-Mäori post-school qualifications by gender
1996
|
||||
|
|
Mäori
|
Non-Mäori
|
||
|
Post school qualification
|
Males
|
Females
|
Males
|
Females
|
|
No qualification
|
82.6
|
84.2
|
65.5
|
72.7
|
|
Basic or skilled vocational
|
9.9
|
7.3
|
14.1
|
7.5
|
|
Intermediate or advanced vocational
|
4.3
|
5.8
|
8.9
|
11.4
|
|
Bachelor degree
|
2.3
|
2.1
|
7.5
|
5.7
|
|
Higher degree
|
0.9
|
0.7
|
4.0
|
2.6
|
|
Total
|
100.0
|
100.0
|
100.0
|
100.0
|
|
Source: Statistics New Zealand, Census of Population and
Dwellings 1996
|
||||
192 As a consequence of, among other things, their lack of qualifications, Mäori are disadvantaged in the competition for jobs. The result is over-representation among the ranks of low-skilled and low-paid workers, a high concentration in industries that are sensitive to economic peaks and troughs (eg, manufacturing) and, since the economic reforms of the late 1980s, widespread unemployment.
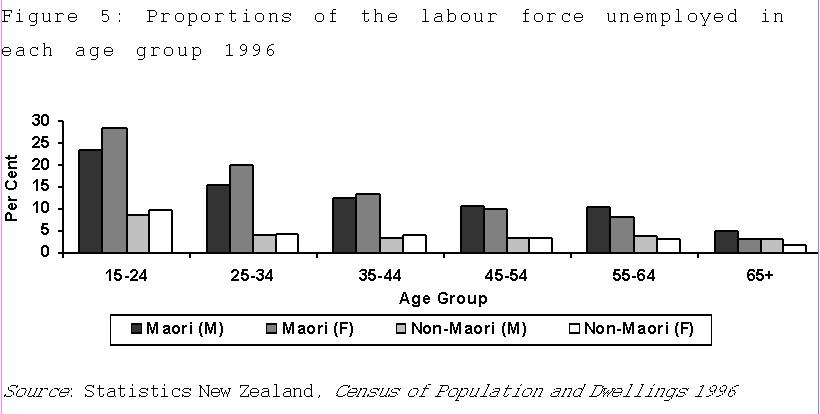
193 Figure 5 compares the unemployment patterns of the four groups – Mäori and non-Mäori males and Mäori and non-Mäori women. Mäori women at all ages are much more likely to be unemployed than Mäori and non-Mäori men and non-Mäori women. It also shows the inter-relationship between age and unemployment. In effect, the older one gets, the less the likelihood of unemployment.
194 What figure 5 does not depict is the effect of the geographic spread of Mäori unemployment. One of the factors influencing the level of unemployment among Mäori is the geographic distribution of the population. As explained earlier, a greater proportion of Mäori than non-Mäori are living outside the five largest urban areas. A high proportion of these Mäori live in regions in which there has been extensive economic restructuring. Jobs are scarce in these areas and given their lack of educational qualifications and skills, few Mäori would be able to compete successfully against their non-Mäori peers in the local job-market.
195 Further, income is related to family composition. Mäori are much more likely than non-Mäori to be living in one-parent families thus reducing the opportunity for those parents to participate in employment. The differences between Mäori and non-Mäori women in respect of family type are illustrated in table 6.
|
Table 6: Mäori and non-Mäori women with dependent children by
family type 1996
|
||
|
Family Type
|
Mäori
|
Non-Mäori
|
|
Two-parents with dependent children
|
58.9
|
80.9
|
|
One-parent family with dependent children
|
41.1
|
19.1
|
|
Total
|
100.0
|
100.0
|
|
Source: Statistics New Zealand, Census of Population and
Dwellings 1996
|
||
196 As table 6 shows, Mäori women are more than twice as likely as non-Mäori women to be living in one-parent families. Moreover, as figure 6 shows, mothers in one-parent families have lower incomes than those living with a partner.

197 Single women with dependent children, whether Mäori or non-Mäori, have similar incomes and by far the greater proportion receive $30,000 or less. Among partnered women, Mäori incomes are lower than for non-Mäori.
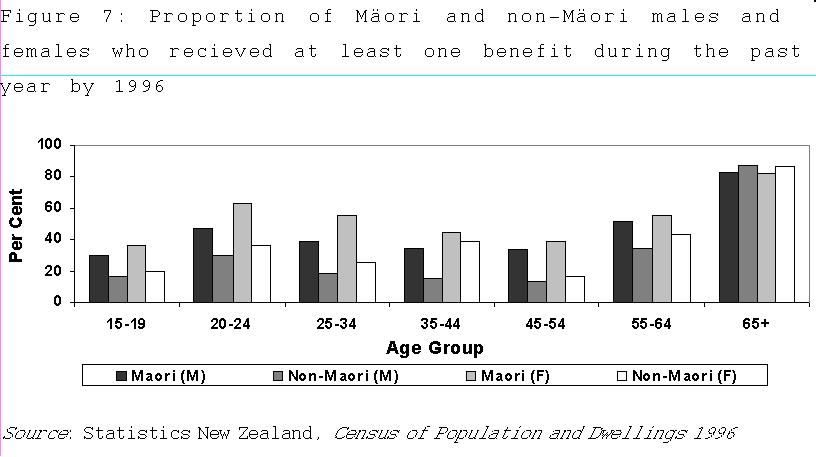
198 Household size, age, geographic distribution, educational attainment, child-care responsibilities and labour market variables are just some of the factors that affect the position of Mäori, and Mäori women in particular. Each reacts on the other in a way that tends to entrench and perpetuate disadvantage. For instance, while a good education is often necessary for securing a well-paid job, whether or not Mäori can achieve the same educational standards as non-Mäori in the absence of a good income is open to debate. However, it is not the inter-relationships themselves that should be of concern since it is the outcome that is important. For Mäori, that outcome is a very high level of dependency. As figure 7 demonstrates, at all ages Mäori women are more likely than non-Mäori women and Mäori and non-Mäori men to be on a benefit of some kind.
199 If disadvantage persists for long enough, it soon perpetuates itself since children brought up in low income families are not likely to have the same opportunities as children in higher income homes. Figure 8 suggests that about 2 in every 5 Mäori children (41.4 percent) are being brought up in families with an annual income of less than $20,000. The comparable figure for non-Mäori children is 1 in 5 (19.9 percent). Thus Mäori children are more than twice as likely as non-Mäori children to be living in families with an income of less than $20,000.

200 Negative disparities in such areas as criminal offending, violence and health are a manifestation of the disadvantages that Mäori women face. Over-use of some parts of the justice system and of other social services is another outcome. As we noted earlier, Mäori women do not act solely on their own behalf in relation to these services. Rather as the centre of their whänau, they advocate for, advise and support their partners, their children and their wider kin group. Against this background, meeting the costs of getting to agencies to make a case, let alone meeting the cost of legal representation and advice, presents a major barrier to Mäori women.
201 In addition to the statistics on victimisation set out in paragraphs 133 and 134, further evidence of the comparatively high incidence of Mäori female victimisation is provided by statistics on hospitalisations. As table 7 shows, in 1995/1996, 42.7 percent of all the female cases treated in public hospitals for injuries inflicted by others were Mäori. Over-representation was highest in the 25–34 and 35–44 years age groups. As these are the ages at which Mäori women are likely to be mothers of pre-school, primary and secondary school children, a significant number of Mäori children are affected. It should be noted that in general, Mäori tend to be higher users of hospitals and accident and emergency facilities, rather than doctors. This could be a significant factor in the higher rates being reported in hospital admissions as non-Mäori may be seeking treatment from their general practitioner rather than the hospital. Again, however, use of public hospitals rather than private general practitioners may well be income related but at this point we have no figures. That Mäori children are themselves very often the victims of violence is also evident from Table 8.
|
Table 7: Mäori hospitalisations for injuries inflicted by others:
Percent of all hospitalisations in age group 1995/1996
|
||||
|
|
Mäori % all hospitalisations
|
Mäori % total NZ population
|
||
|
Age group
|
Males
|
Females
|
Males
|
Females
|
|
0–14
|
27.5
|
32.1
|
23.5
|
23.7
|
|
15–24
|
24.3
|
40.9
|
18.1
|
18.9
|
|
25–34
|
26.5
|
52.1
|
14.6
|
15.4
|
|
35–44
|
21.0
|
46.5
|
11.7
|
12.2
|
|
45–54
|
12.6
|
40.7
|
8.8
|
9.1
|
|
55–64
|
18.9
|
7.7
|
8.1
|
8.3
|
|
65+
|
34.3
|
9.1
|
3.9
|
3.6
|
|
Total
|
24.1
|
42.7
|
14.5
|
14.4
|
|
Source: New Zealand Health Information Service, 1995/1996
|
||||
202 Mäori males and females, especially those in the younger age groups, are also over-represented among those discharged from or dying in hospital as a result of self-inflicted injuries. As table 8 shows, more than a quarter (26.4%) of the female cases aged 0-14 years were Mäori and 16.6% of the male cases in the same age group. Mäori women are at greater risk than Mäori men of being hospitalised for self-inflicted injuries.
|
Table 8: Mäori hospitalisations as a percentage of all
hospitalisations for self-inflicted injuries by age and gender 1995
|
||
|
Age group
|
Males
|
Females
|
|
0–14 years
|
16.6
|
26.4
|
|
15–19 years
|
14.8
|
18.3
|
|
20–24 years
|
15.6
|
18.1
|
|
25–34 years
|
14.0
|
18.1
|
|
35–44 years
|
9.7
|
10.3
|
|
45–54 years
|
7.3
|
12.4
|
|
55-64 years
|
9.1
|
4.3
|
|
65 years & over
|
2.0
|
6.0
|
|
Total
|
12.7
|
16.2
|
|
Source: New Zealand Health Information Service, 1995 (Provisional)
|
||
203 In 1992, Mäori made up a third of all school suspensions and expulsions. By 1997, the proportion had risen to nearly 42 percent. Table 9 shows that compared to their proportion in the total school population, Mäori are significantly over-represented among pupils who are expelled or suspended from school.
|
Table 9: Mäori students suspended and expelled from school: Numbers
and percent of all students 1992 and 1997
|
||
|
Suspensions and Expulsions
|
1992
|
1997
|
|
Mäori
|
1,694
|
4,772
|
|
Non-Mäori
|
3,388
|
6,682
|
|
Mäori percent all suspensions and expulsions
|
33.3
|
41.7
|
|
Mäori percent total school population
|
19.6
|
19.8
|
|
Source: Te Puni Kokiri, Progress Towards Closing Social and Economic
Gaps Between Mäori and Non-Mäori, 1998
|
||
204 The persistence of negative socio-economic disparities has been a major concern of successive governments and of Mäori commentators for many years now. For the latter, the inadequacy of response to address the issues is a symptom of a more fundamental failure to recognise and acknowledge that cultural dislocation is an underlying factor in Mäori socio-economic disadvantage. The argument is that the starting point for the development of effective policies and programmes is the identification and clarification of the underlying cultural issues.
205 Perhaps the most important resource for agencies that are seeking to respond to Mäori issues is an official information-base that is relevant to Mäori. Until very recently what information was collected about Mäori was shaped largely by Government priorities. Since 1991, when a question on iwi was included in the census for the first time since 1901, Statistics New Zealand has been working on the extension and development of a series of statistics that meets the needs of Mäori users. These statistics take into account cultural factors and their inclusion in the official statistical system can be expected, from a Mäori point of view, to result in better informed, and hence more effective, policies.
206 As yet, the information is limited. In this section, we use the available data to provide the necessary context for weighing the views expressed by the women during the consultations. Data presented in this section is intended to show the extent to which Mäori culture has been eroded and the efforts that Mäori themselves are making to retrieve the situation. The underlying argument is that Mäori need the help and the support of agencies in this endeavour.

207 Nearly two-thirds of all Mäori women aged 15 years and over live in a household made up of a single person or in a one or two-parent family with no others present. On the other hand, more than one in five lives in a household that they share not just with members of their immediate nuclear family but with other kin as well. Some of the households in this category comprise two related nuclear families, some are made up of siblings, and others are nuclear families which have relatives living with them.
208 As can be seen from figure 9, Mäori women are far more likely than non-Mäori women to be living in households shared with relatives other than their immediate family.
209 Moreover, other studies have shown that the whänau is a reality for Mäori families, whether or not they have relatives living with them. A separate study being conducted for Te Puni Kökiri has found that nearly all of those families that do not have relatives living with them in the same household have one or more close and not so close family members living in the same district. It also found that there is a high degree of co-operation among the different households that make up the whänau. Among other things, the whänau provides financial support, food, child-minding services, advocacy and moral support for its members.
210 Until very recently it was generally supposed that iwi identification was no longer important to the majority of Mäori. The 1996 Census found, however, that most Mäori were able to provide the name of their iwi in response to the question on iwi affiliation. The proportion that either did not know or that failed to state an iwi was relatively small (27.6 percent of men and 25.4 percent of women).
|
Table 10: Knowledge of iwi 1996
|
||
|
Response to iwi question
|
Males
|
Females
|
|
Iwi specified
|
72.4
|
74.6
|
|
Not known or not specified
|
27.6
|
25.4
|
|
Total
|
100.0
|
100.0
|
|
Source: Statistics New Zealand, Census of Population and Dwellings
1996
|
||
211 The question on iwi affiliation is asked of all persons of Mäori descent. A detailed analysis of those who did not state an iwi shows that two factors affect the size of this group. The first is whether or not those people identified as Mäori and the second is age. Over a third (35 percent) of this group said they were of Mäori descent but did not identify themselves as Mäori. They are, in other words, people who are descended from a Mäori but who identify culturally with other ethnic groups.
212 The effect of age is demonstrated in the next table. In effect, more than half of those who failed to give an iwi (54.2 percent) were under the age of 25 years. While it is correct that over half of those who did not give an iwi were aged under 25, over half the Mäori descent population were aged under 25. This is really a reflection of the age distribution of the Mäori descent population. What the graph shows is that in the younger age groups, there is a higher proportion of people who did not give an iwi.16
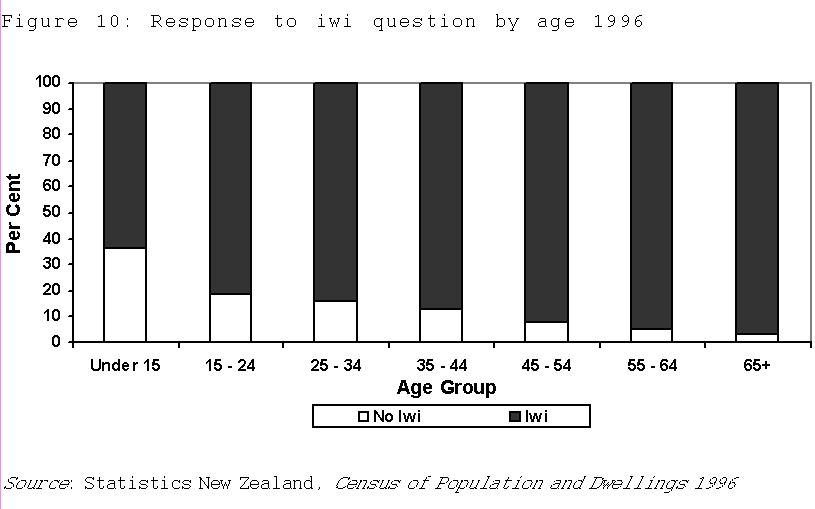
213 It is in the area of the Mäori language that the effects of the assimilative policies of the past are most obvious. According to

the 1996 Census, which was the first census to include a question on languages, only 25 percent of Mäori women and 24 percent of Mäori men are able to have a conversation in Mäori about a number of everyday things. Figure 11 shows that ability to speak Mäori is age-related. The proportions that are able to speak the language rise with age.
214 Mounting concern over the survival of the Mäori language led, in the 1980s, to a number of initiatives in the area of education. April 1982 marked the opening of the first Köhanga Reo. Three years later, the first Kura Kaupapa Mäori was opened. Demand for instruction by way of Mäori language has resulted in a rapid growth in the numbers enrolled in Mäori medium programmes or the study of Mäori as a subject.
|
Table 11: Mäori enrolments in Mäori language initiatives 1992 and
1997
|
|||
|
|
|
Total enrolments
|
|
|
Sector
|
Initiative
|
1992
|
1997
|
|
Early childhood Schools
|
Köhanga reo
|
11,041
|
13,353
|
|
Kura Kaupapa Mäori
|
507
|
3,919
|
|
|
Mäori-medium
|
15,544
|
23,262
|
|
|
Mäori as a subject
|
30,940
|
25,528
|
|
|
(Total schools
|
46,991
|
52,709)
|
|
|
Tertiary
|
Wananga
|
261*
|
962
|
|
Total
|
|
58,392
|
67,024
|
|
Source: Te Puni Kökiri, Nga Ira Tangata: Mäori Towards
2000, 1998; Te Puni Kökiri, The National Mäori Language
Survey, 1998
|
|||
|
* The first Wananga was opened in 1994 and the figure of 261 refers to
1994
|
|||
215 The 67,000 or so Mäori children enrolled in Mäori language initiatives within schools made up 47 per cent of the total number of Mäori school enrolments in 1997. In spite of the numbers involved in these initiatives, the second Mäori Language Survey conducted in 1995 suggests that the survival of the Mäori language is still in doubt (The National Mäori Language Survey, Te Puni Kökiri, 1998).
216 This broad analysis of enrolments in Mäori language initiatives highlights the effort that is being put in to the preservation of the language. This effort, moreover, is a joint one which serves to demonstrate what can be achieved when a state agency lends support to a Mäori initiative. Enrolment in these schools and classes is a matter of choice. By taking up the opportunity, parents are demonstrating their own commitment to the language as well as to the retention of a separate cultural identity. Although they might not speak the language themselves, they are ensuring through their children, the survival of Mäori language and culture. This dispels any notion that Mäori cultural values might be dying.
217 Mäori women consulted at the Law Commission hui suggested that a greater number of Mäori in the legal profession and among the staff of the service delivery agencies would go a long way toward reducing the socio-cultural distance they felt existed between themselves and the institutions. There are, however, too few Mäori lawyers to meet the demand.
218 At the 1996 Census there were about 366 Mäori lawyers. They represented 5.2 percent of all lawyers. Most of them were in private practice but a substantial proportion (27.8 percent) were employed in the government sector and so were not providing legal advice and advocacy services directly to clients.
|
Table 12: Mäori and non-Mäori in the legal profession by sector
of employment 1996
|
||||
|
|
Mäori
|
Non-Mäori
|
||
|
Sector
|
Males
|
Females
|
Males
|
Females
|
|
Government
|
54
|
48
|
669
|
447
|
|
Private non-profit services
|
6
|
3
|
24
|
45
|
|
Other private
|
162
|
78
|
4,119
|
1,602
|
|
Not specified
|
9
|
6
|
105
|
27
|
|
Total
|
231
|
135
|
4,917
|
2,121
|
|
Source: Statistics New Zealand, Census of Population and
Dwellings 1996
|
||||
219 As far as the government social service agencies are concerned, Mäori are reasonably well-represented in relation to their proportion in the labour force as a whole. For example, whereas, Mäori made up 11 percent of the total number of persons employed, within the Children and Young Persons Service, the Department of Courts and the Department of Corrections, Mäori represented, respectively, 20 percent, 15 percent and 20 percent of the total staff. Unfortunately, the State Services Commission review does not include the Police (State Services Commission 1997).
220 As the true proportion of Mäori women among the clients of these agencies is not known, it is not possible to judge what the representation of Mäori among the staff would be appropriate. However, there does seem, on the face of it, to be an inconsistency between the Mäori women participants’ perceptions and the factual evidence. How is this to be accounted for? First, the statistics presented in the State Services Commission review are not broken down by region and the numbers of Mäori staff could vary considerably from region to region. Second, Mäori staff might not be readily visible to clients. They may be working in areas away from the front-line. There may be other reasons as well.
221 It is suggested on the basis of the evidence presented in this paper, that Mäori women are more frequent users of Police, Courts and Correction services than non-Mäori women. It is further suggested that they are more frequent users of related services such as those provided by the Children and Young Persons Service. Mäori women’s use of lawyers’ services, however, is impossible to determine, as there is no data available on this part of the justice system.
222 The analysis has found that the women’s concerns about physical distance from the justice sector services and the costs involved in accessing them can be related, at the national level, to the regional and urban-rural distribution of the Mäori population and to the relatively greater inaccessibility of telephones and cars. By virtue of their location and lack of access to a telephone or car, accessing the services is likely to involve higher costs for a substantial proportion of Mäori women. In view of the relatively low level of Mäori household income and the larger number of household members, the costs are likely to be prohibitive for many. The budget may simply not stretch enough to accommodate them. Under these circumstances, Mäori are less likely to find the money to meet the cost of legal services.
223 The evidence suggests that in some of the relevant agencies, the proportion of Mäori on the staff exceeds the proportion of Mäori in the total New Zealand population. However, this might not be the best way of assessing what the appropriate Mäori staffing level should be. The proportion of Mäori among the users of the agency might be a better basis. While getting the staffing ratios right is obviously important in improving the image the agency presents to Mäori users, this is unlikely to be sufficient on its own to dispel their negative perceptions. Promoting an organisational culture which permits Mäori staff to interact with Mäori users of services and supports them in this approach is likely to be just as important. So too is appointing Mäori to positions from which they can influence the way in which services are delivered to Mäori.
224 As far as the legal profession is concerned, a substantial proportion of Mäori trained in law are working outside of legal practice. However, even if they were practising, they are still too few in number to bring about any real change in the image that Mäori have of the profession.
225 In this chapter, we suggest that demographic, cultural and socio-economic factors intertwine in a way that entrenches and perpetuates disadvantage. Disadvantage and poverty tend to take the form of a vicious circle, such that low income can be seen as both a cause and an effect of such things as low educational achievement and poor employment outcomes.
226 The current tertiary policy settings drive towards:
227 While such a combination of policy settings for tertiary education occurs in other countries for example, (Australia, the UK and Canada), equity funding and equity access scholarships are provided to help cope with access issues. A balanced delivery of equal educational opportunities is in the country’s long-term interests. Without such mechanisms the task of providing equal educational opportunities for low-income, educational-disadvantaged students is almost impossible.
228 Auckland has the highest concentration of Mäori (46% of the total Mäori population); Pacific Island (55% Pacific Island of the total population) and low income households in the country. The educational profile of these populations is on average, one of educational disadvantage. If students belong to populations with high rates of unemployment, and low levels of life time earnings, the ability to finance studies, even by way of a loan, is non-existent.
229 Low educational achievement and poor employment outcomes are not going to change if Mäori have difficulty accessing and participating in tertiary studies. Mäori women have suggested that more Mäori lawyers and judges will enable them to participate better in the justice system. However, if the falling Mäori roll at Auckland university is any indicator of the trend of Mäori participation at tertiary level, then the prospect of more Mäori lawyers and the prospects for participation by Mäori women in the justice system are gloomy indeed.
NZLII:
Copyright Policy
|
Disclaimers
|
Privacy Policy
|
Feedback
URL: http://www.nzlii.org/nz/other/nzlc/report/R53/R53-4.html